Media Cloud Project
Media Cloud Visualizations
03/20/09 11:16 Filed in: visualizations
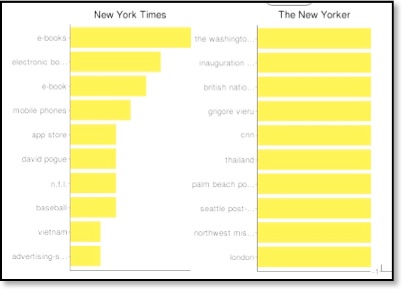
The Media Cloud Project allows you to input several data sources, like the New York Times, and create a visualization of the most frequent words, or the words most often associated with a term you enter. Quite interesting. The graph above was for a search on most-related terms for "books."